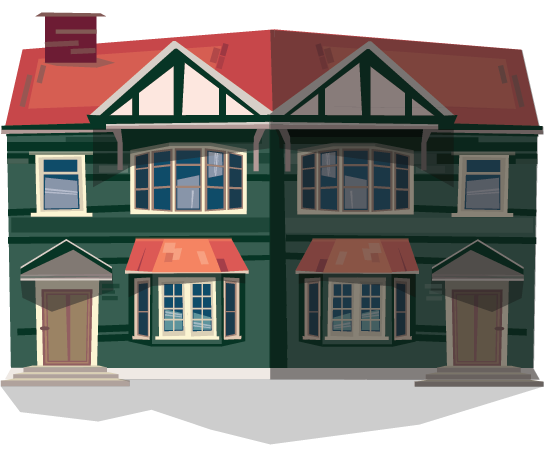
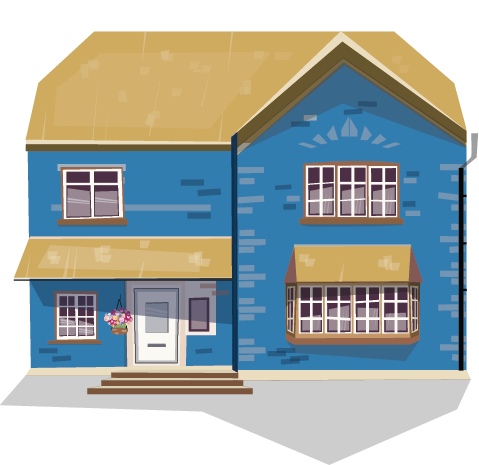
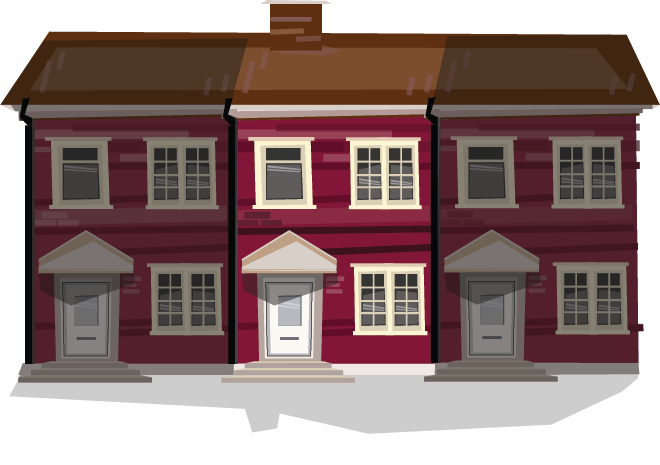
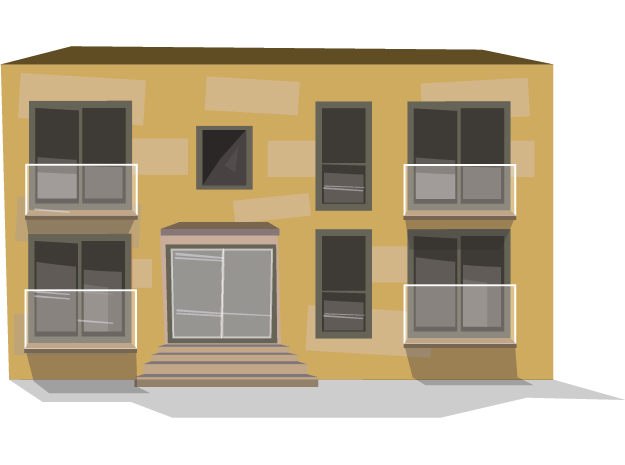
If the entire UK population were condensed into just a single street, most of us (32%) would live in a £206,873 semi-detached house. 25% of the UK population would live in a £332,893 detached home, and 26% would live in a £177,379 terraced house. The least (14%) would live in an apartment, which equates to over nine million people.
Rather predictably, London property prices prop up the average for the rest of the country. As the table below and interactive graphic above show, apartments are by far the most common property type in the capital, with 43% of people residing in them and costing an average of £428,476, four times higher than the price in the North East.
In many ways, the capital bucks the national trend – outside of London, the average apartment price is £132,000, with just a 9.8% average across England and Wales (excluding the 29% of Scotland living in apartments) and the lowest average apartment price in Northern Ireland of £97,242.
If the entire UK population were condensed into just a single street, most of us would live in a £206,873 semi-detached house
If we imagine the street depicting just the North East region, for instance, (use the ‘select region’ tab above the interactive graphic to see), almost a third of the population would live in a terraced house with a value of £98,680. Just short of half the national average for a house of that type and staggeringly short of the £494,851 average in London.
What’s most striking from the research is the diversity across the UK, which raises plenty of fascinating socio-economic and geographic questions. Property prices just outside of London are elevated in areas within a commutable distance, with prices dropping off nearer the South West.
The results also provide a complete picture to both house buyers and first-time buyers. They can visualise the property ladder they’re climbing and see where’s most affordable for the type of property they’re looking for, highlighting areas within their budget.
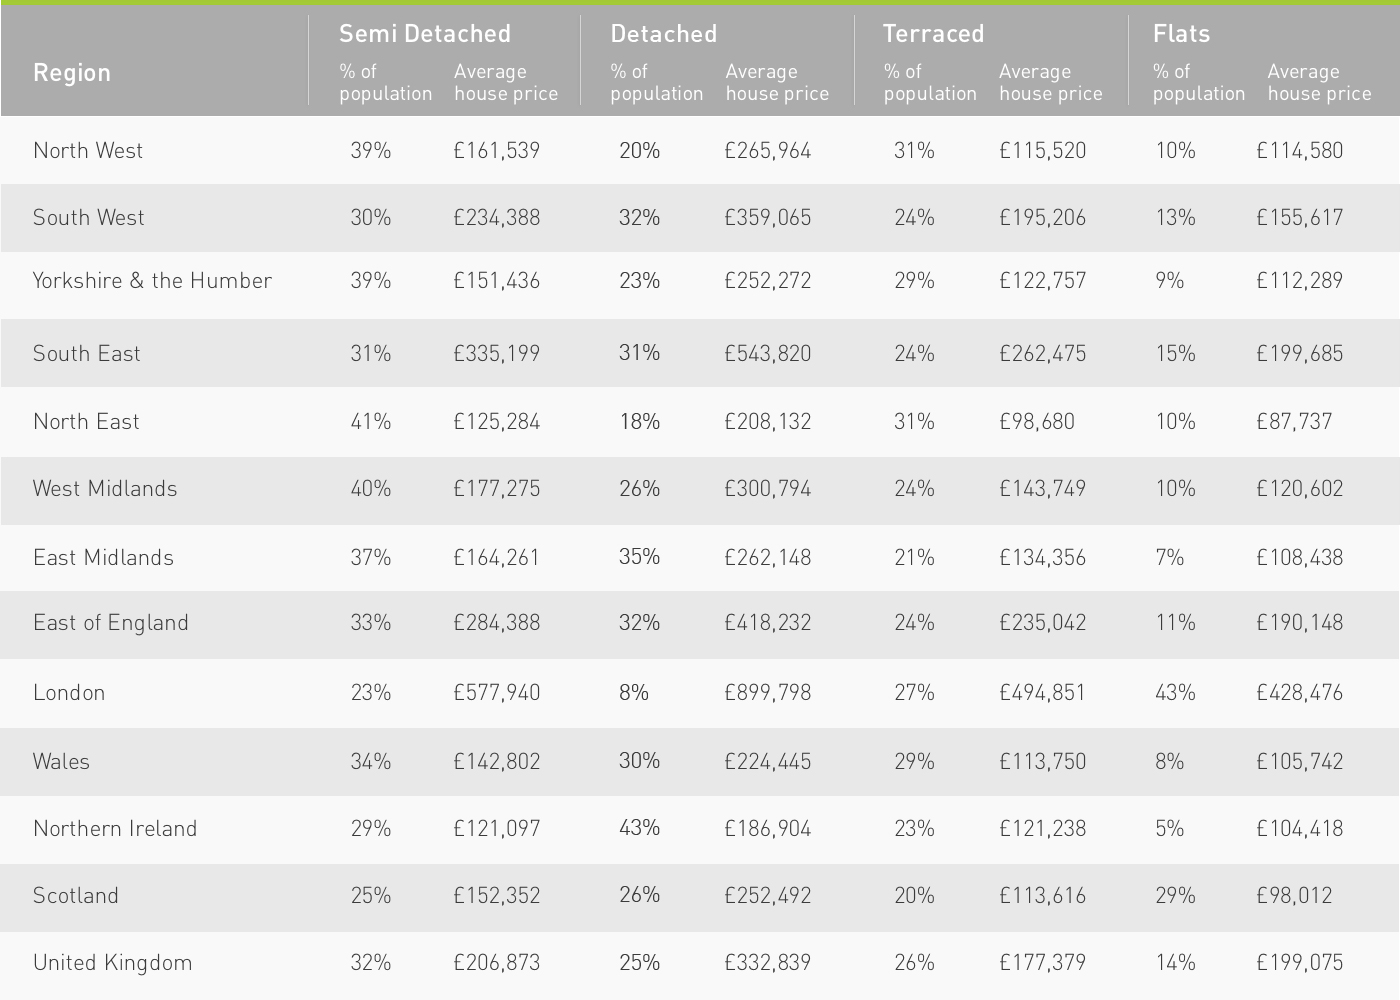
| Region | Semi Detached % of population |
Semi Detached Average house price |
Detached % of population |
Detached Average house price |
Terraced % of population |
Terraced Average house price |
Flats % of population |
Flats Average house price |
|---|---|---|---|---|---|---|---|---|
| North West | 39% | £161,680 | 20% | £265,964 | 31% | £115,520 | 10% | £114,580 |
| South West | 30% | £234,388 | 32% | £359,065 | 24% | £195,206 | 13% | £155,617 |
| Yorkshire and The Humber | 39% | £151,436 | 23% | £252,272 | 29% | £122,757 | 9% | £112,289 |
| South East | 31% | £335,199 | 31% | £543,820 | 24% | £262,475 | 15% | £199,685 |
| North East | 41% | £125,284 | 18% | £208,132 | 31% | £98,680 | 10% | £87,737 |
| West Midlands | 40% | £177,275 | 26% | £300,794 | 24% | £143,749 | 10% | £120,602 |
| East Midlands | 37% | £164,261 | 35% | £262,148 | 21% | £134,356 | 7% | £108,438 |
| East of England | 33% | £284,388 | 32% | £418,232 | 24% | £235,042 | 11% | £190,148 |
| London | 23% | £577,940 | 8% | £899,798 | 27% | £494,851 | 43% | £428,476 |
| Wales | 34% | £142,802 | 30% | £224,445 | 29% | £113,750 | 8% | £105,742 |
| Northern Ireland | 29% | £121,097 | 43% | £186,904 | 23% | £85,713 | 5% | £97,242 |
| Scotland | 25% | £152,352 | 26% | £252,492 | 20% | £121,238 | 29% | £104,418 |
| United Kingdom | 32% | £206,873 | 25% | £332,839 | 26% | £177,379 | 14% | £199,075 |
If you’re on the hunt for a new home and can’t decide which type of property is right for you or how to navigate the market, explore our guide to home buying to help you get moving now.
Data was sourced from the Land Registry UK House Price Index dated April 2017, ONS Census Data for England and Wales, NRS Census Data in Scotland and NISRA Census Data in Northern Ireland.

